It showed that an output of South Korean robots surpassed $3.67 billion (4 trillion KRW) in 2016. Although South Korean robots achieved quantitative performance, now expansion towards high-value markets for qualitative growth is requested.
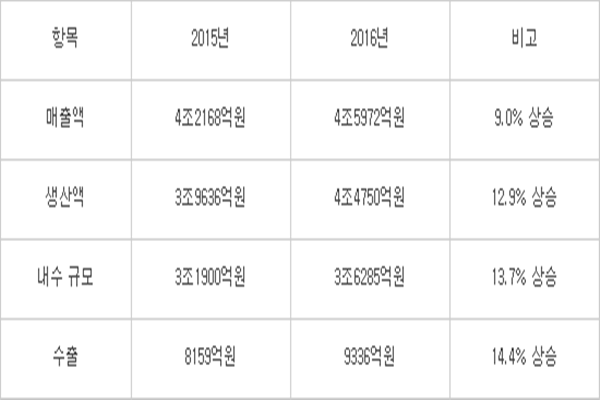
According to Korea Association of Robot Industry’s report on factual survey of South Korea’s robot industries in 2016, an output of South Korean robots was $4.11 billion (4.475 trillion KRW) in 2016 which is 12.9% increase than an output in 2015 when it was $3.64 billion (3.9636 trillion KRW). Due to an increase trend of number of demands of robots globally, domestic sales and amount of exports both showed upward trends. Its domestic sales increased from $2.93 billion (3.19 trillion KRW) to $3.33 billion (3.6285 trillion KRW) while amount of exports increased from $749 million (815.9 billion KRW) to $857 million (933.6 billion KRW).
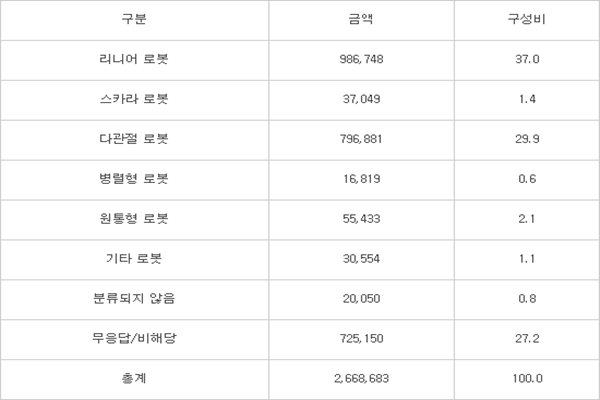
Industrial robots, robots for professional services, robots for personal services, and robotic parts all showed steady growth. Industrial robots take up the biggest percentage out of South Korea’s robot industries. Industrial robots are responsible for $2.45 billion (2.6687 trillion KRW) out of $4.11 billion (4.475 trillion KRW). Field of robotic parts also made a huge jump.
Even though industrial robots have made quantitative growth, fact that there are not too many high-value robots is still remain as a limitation. Linear robots (rectangular coordinate robot) are responsible for $906 million (986.7 billion KRW) out of an output of industrial robots and they represent the largest percentage. Rectangular coordinate robots cost about $4,592 (5 million KRW) and their unit costs are relatively low.
Although quantitative growth is encouraging, it is urgent for South Korea’s robot industries to shift center of their focus to high-value products.
Followed by linear robots, articulated robots are responsible for $732 million (796.9 billion KRW). Articulated robots are divided into horizontal articulated robots and vertical articulated robots. Although vertical articulated robots are seen as high-value robots out of industrial robots, only Hyundai Robotics is showing meaningful performance out of South Korean businesses. Considering the fact that Hyundai Robotics made about $230 million (250 billion KRW) in sales last year, it can be seen that the output of horizontal articulated robots almost doubles the output of vertical articulated robots.
Vertical articulated robots are usually used as robots for transferring semiconductor wafers and display panels. Robostar, DSTRobot, and TES-Robot are seen as major vertical articulated robot manufacturers in South Korea.
“Although it is true that unit cost of a horizontal articulated robot is lower than that of a vertical articulated robot, it is encouraging to see that unit cost of a horizontal articulated robot is becoming same as unit cost of a vertical articulated robot as generations go by.” said a representative for an industry. “This trend is happening because vertical articulated robots are also becoming generalized as sizes of wafers and displays are becoming bigger.”
Circular robots ($50.9 million (55.4 billion KRW)), SCARA robots ($34 million (37 billion KRW)), and parallel robots ($15.4 million (16.8 billion KRW)) are responsible for less than 2% respectively.
Amount of exportation of South Korean robots in 2016 was $857 million (933.6 billion KRW). Out of $857 million, industrial robots were responsible for 72.9% ($625 million (680.6 billion KRW)). Robotic parts and components followed industrial robots with 10.8%.
China is the country where most of South Korean robots were exported to. Total amount of exportation of South Korean robots to China was $360 million (392.5 billion KRW). U.S. ($149 million (162.6 billion KRW)) and Japan ($68.3 million (74.4 billion KRW)) followed China. South Korea imported most of its robots from Japan that are worth $317 million (345 billion KRW). China ($78.4 million (85.4 billion KRW)), U.S. ($75.8 million (82.5 billion KRW)), and Germany ($38.4 million (41.8 billion KRW)) followed Japan.
Staff Reporter Lee, Youngho | youngtiger@etnews.com