Samsung Electronics’ TVs including QLED TVs are doing quite well in premium TV markets.
This indicates that its strategies to take actions towards requests from its consumers were very effective. It is expected that Samsung Electronics will find its sales increase according to a very busy season for TVs.
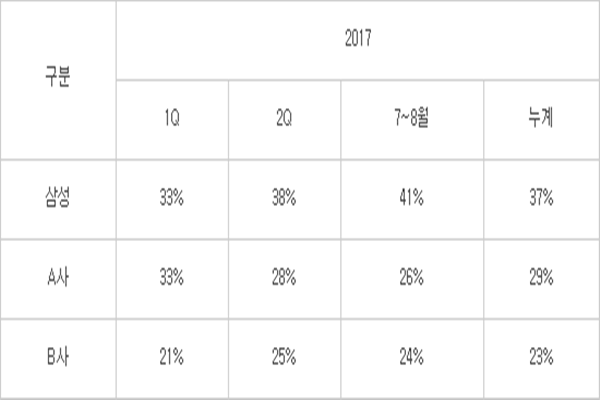
Samsung Electronics quoted information from market research companies called GFK and NPD and made an announcement on the 22nd that its share in markets for premium TVs that cost at least $2,500 increased from 32% early this year to 42% in August. Even in markets for TVs that cost at least $2,000 and $3,000, it holds very high market shares of 44% and 43% respectively.
It also has high shares even in markets for TVs with large screens. It recorded 42% of share in markets for TVs that have at least 60-inch screens and it is especially unrivaled in markets for TVs that have at least 80-inch screens as it holds 70% of market share. In entire TV markets, it holds about 33% to 35% of market share.
In order to break through TV markets that have become stagnant since 2011, Samsung Electronics has carried out premium strategies that have set forth excellent quality that has led to its success in TV markets.

Although QLED TVs are doing well, Samsung Electronics pointed out that there can be a distortion to market share of QLED TVs as market research companies analyze data different from each other. Although market share of QLED TVs is 42% in markets for TVs that cost at least $2,500 based on GFK and NPD, it is only 17% based on IHS. This happens because there are differences between market research companies when it comes to unit, price, and way of research. While GFK and NPD base their information on actual selling price of individual model, IHS calculates its data based on estimated average price after dividing products into major categories.
For example if a company sells ten TVs worth $3,000, ten TVs worth $2,000, and another ten TVs worth $1,000, its estimated average price is $2,000 based on how IHS calculates its data. Corresponding value is not counted for market share for TVs that cost at least $2,500. This indicates that this company’s sales volume in those ten TVs worth $3,000 is left out.
Samsung Electronics’ stance is that accurate data is not reflected by IHS because although it has ‘OLED TV’ as one of TV categories, it does not have ‘QLED TV’ as one of TV categories.
“We expect that there will be excellent results in this fourth quarter through effects of annual busy seasons such as Black Friday and premium strategies such as increasing sales of QLED TVs where 50% of them have screens that are at least 65 inches.” said Executive Director Lee Yoon of Samsung Electronics’ Video Display Business Department.
Staff Reporter Ham, Jihyeon | goham@etnews.com