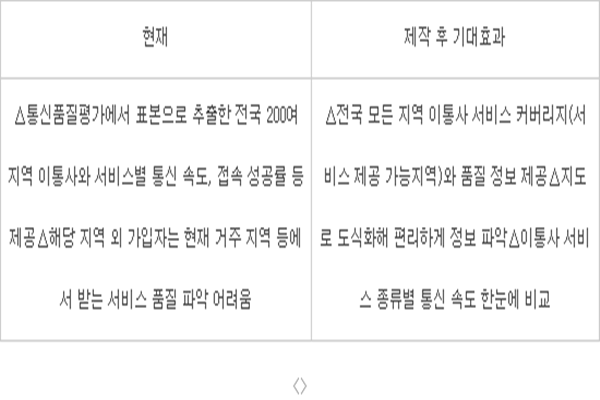
A map which allows one to understand data quality and mobile communication calls at a glance is coming out. Not just 3 mobile carriers’ service ranges, but kinds of services and speeds by regions can also be known. Because it can be compared at a glance, it is predicted that competition in quality between mobile carriers will be more fierce.
Ministry of Science, ICT, and Future Planning (MSIP) announced on the 2nd that it is starting establishment of basic planning anddraw-up of the map in the second half of this year with having the thought of releasing mobile communication coverage map in the first half of next year. 3 mobile carriers decided to participate into this project with the mind of improving customers’ convenience level.
Variety of indicators that allows one to objectively understand mobile communication service quality standard will be contained in this coverage map. Different kinds of services such as range of service coverage, 3G and 4G, Wibro, Wi-Fi, speeds by regions, and delay times will be indicated. Current situation of mobile communication service quality in major foreign cities and information about its comparison will also be included.
MSIP is utilizing results from ‘2015 communication quality evaluation’ that will be announced at the end of this year, information that is provided by mobile carriers, and Big Data information that is collected from National Information Society Agency (NIA) speed measurement application. People have downloaded NIA speed measurement application more than 100,000 times, and regions and speed information are accumulated in it as Big Data.
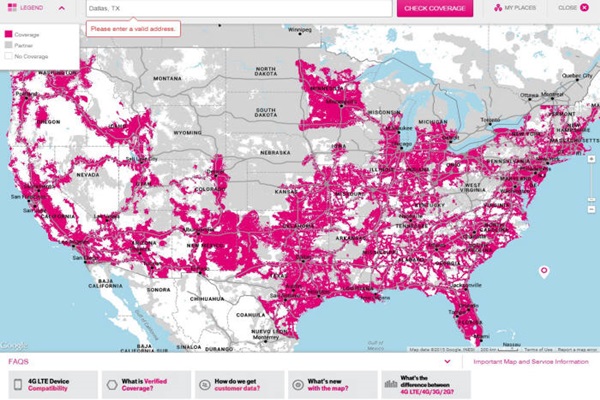
MSIP is publicizing coverage map in the form of administrative agency public information. U.S. is providing America’s whole service coverage map on mobile carriers’ homepages. Although Federal Communications Commission deleted responsibility rule in 2002, mobile carriers are voluntarily publicizing information.
AT&T map shows signal strength and 4G, 3G, and 2G coverage in a form of services such as voice and data, wireless, and Wi-Fi. Not just the U.S., but many European countries including France are providing coverage maps.
“Purpose of coverage map is for users to objectively compare communication service qualities and induce them to make reasonable choices. While other countries’ coverage maps only show 3G and LTE ratio, we are planning to input more detailed and variety of information into our coverage maps." Team Leader Park Min Ha of MSIP’s Communication Policy Plan Department said about the difference between Korea’s coverage map compared to others.
When maps get released, users can obtain service information about places that they reside, which helps them to choose mobile carriers and services more rationally. Until now customers couldn’t understand why their mobile carriers’ voice signals are weak and why their data communication wouldn’t work.
“I had to withdraw from opening just in 2 weeks from purchasing a Galaxy S6 Edge from a mobile carrier because download speed was very slow and it felt like Galaxy Note 2. People can fall into mobile carriers’ exaggerated advertisements if they purchase phones without testing their download speeds around their residences or work.” One Netizen said about problem that the lack of information of communication service causes.
MSIP is providing result of communication quality assessment yearly at Smart Choice where variety of information regarding communication service is provided. Only measured values at about 200 sample locations are shown in the quality assessment. If service coverage and quality of entire Korea is shown in the map, then customers’ convenience levels will increase accordingly.
One can hope for competition between mobile carriers and effects of inducing investments. Because more detailed information is provided than communication quality assessment, there are increased amounts of investments in equipment per mobile carriers. It is predicted that service quality in vulnerable area such as seaside or island area will increase.
Decision to whether indicating LTE services in LTE-A, broadband LTE-A, and 3-Band Lte-A (3-Band CA) will need to be further discussed. Although it is possible technologically, it needs to be discussed because 3-Band CA base station hasn’t been installed in all network and there are a lot of deviations per mobile carriers according to Etnews investigation.
Staff Reporter An, Hochun | hcan@etnews.com